

The median U.S. home-sale price climbed to $408,776 in June, while sales activity strengthened and new listings moved lower.
The U.S. housing market gained momentum in June 2026, pushing home prices to a new record.
The median home-sale price rose 2.2% year over year to $408,776, the highest level on record. The increase came as buyer demand improved, completed sales rose from a year earlier, and the supply of newly listed homes tightened.
The market is not returning evenly, however. Affluent buyers are driving much of the activity in several expensive coastal markets, while elevated mortgage rates continue to restrict purchasing power for many first-time and middle-income buyers.
.
Home Sales Reached Their Strongest Level in Years
Existing-home sales edged up 0.1% from May to a seasonally adjusted annual rate of approximately 4.4 million—the highest level since November 2022. Compared with June 2025, existing-home sales increased 4.2%.
Pending sales also moved higher, rising 0.5% month over month and 4.5% year over year. Aside from April, June recorded the strongest level of pending sales since 2023.
Total closed sales, including both existing and newly built homes, declined slightly from the previous month but remained 4.5% higher than a year earlier.
These figures point to a clear shift: buyers are re-entering the market despite high home prices and mortgage rates that remain well above the levels seen earlier in the decade.
.
Wealthy Buyers Are Reshaping Coastal Markets
The strongest price and sales increases were concentrated in markets attracting high-income buyers.
San Francisco recorded the largest annual home-price gain among the major metros analyzed, with the median sale price rising 9.2%. Pittsburgh followed at 9.1%, while West Palm Beach increased 8.6%.
Closed sales climbed roughly 23% year over year in both San Francisco and West Palm Beach—the largest gains among major U.S. metropolitan areas.
Demand in the Bay Area is being supported by high-income technology workers and wealth connected to the artificial-intelligence sector. In South Florida, favorable taxes, warm weather, and demand for luxury properties continue to attract wealthy households.
This strength at the top of the market is helping lift national prices, even as many typical buyers remain constrained by affordability.
.
High Mortgage Rates Continue to Divide the Market
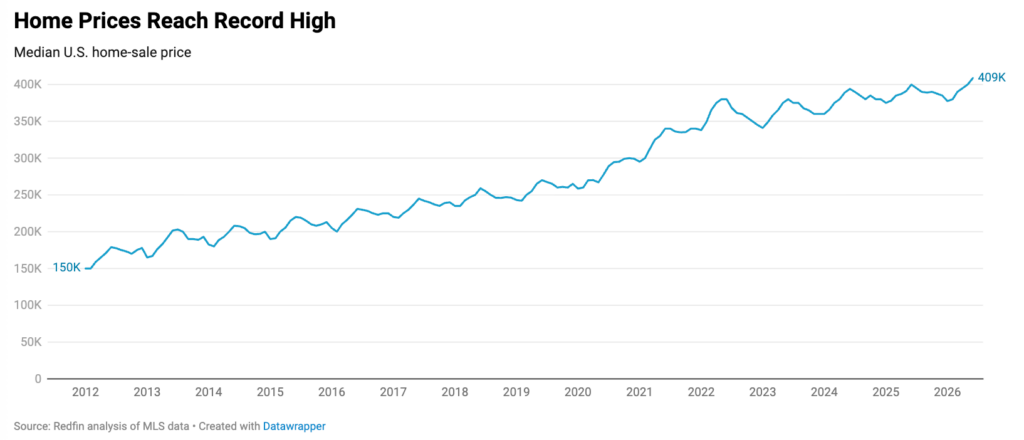
The average 30-year fixed mortgage rate was 6.49% in June, slightly higher than in May. Combined with record home prices, that increase placed additional pressure on monthly housing payments.
Higher-income buyers are better positioned to absorb elevated borrowing costs or make larger down payments. First-time buyers and households relying more heavily on financing face a different market, where even a small change in the mortgage rate can meaningfully alter the monthly payment.
Price growth has slowed compared with recent years. U.S. home prices were increasing by roughly 5% annually during much of 2024 and posted double-digit gains during parts of the pandemic-era buying surge. June’s 2.2% increase was more moderate and remained below recent wage growth, offering a limited improvement in affordability despite the record price level.
.
Competition Reached a One-Year High
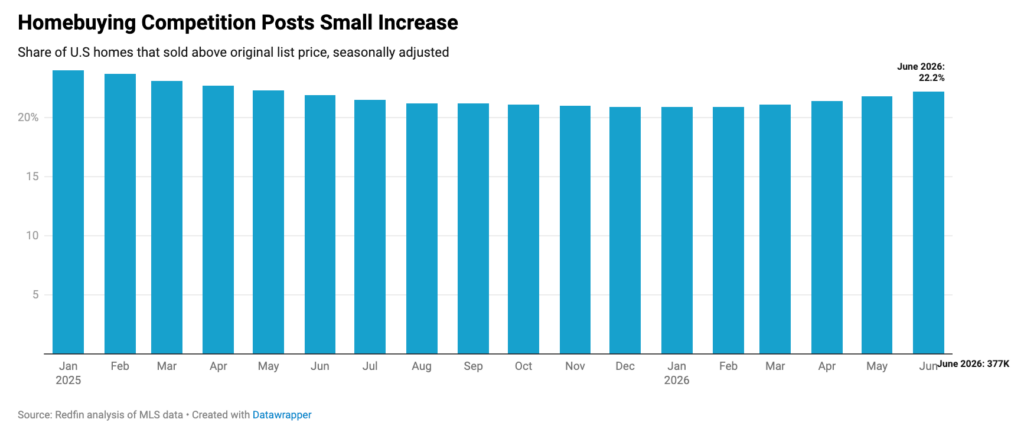
Buyer competition also strengthened in June.
Approximately 22.2% of homes sold for more than their original asking price, the highest seasonally adjusted share in more than a year. Renewed competition contributed to the increase in the national median sale price.
At the same time, the market continued to favor buyers in many locations. Nearly 59.5% of homes sold below their original list price, and the typical home spent 49 days on the market.
The national figures therefore reflect two conditions at once: competition is rising for desirable homes and in high-demand markets, but buyers still retain negotiating power across a large portion of the country.
.
New Listings Fell as Sellers Pulled Back
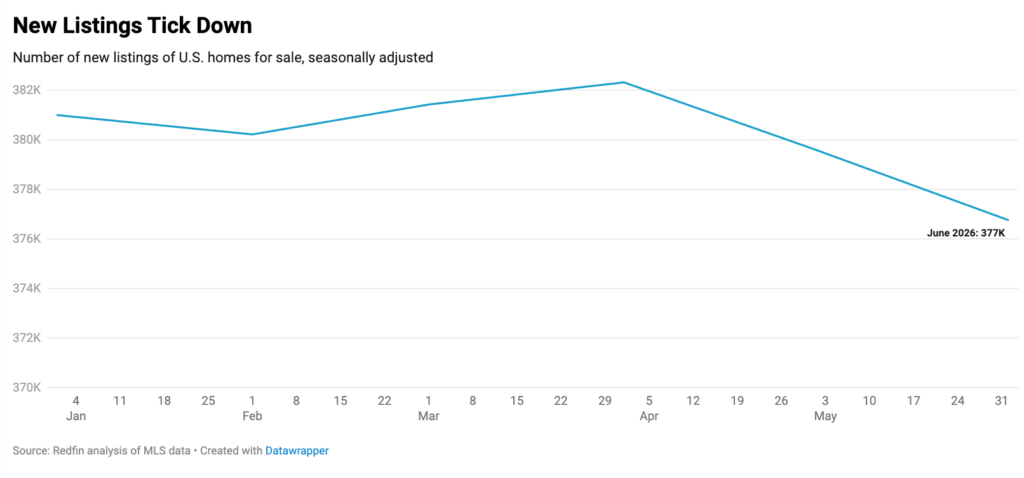
New listings declined approximately 1% from May, reaching their lowest level since December.
Some homeowners are delaying plans to sell because many markets still contain more sellers than active buyers. Others remain reluctant to exchange an existing low-rate mortgage for a new loan at today’s higher rates.
The largest annual declines in new listings occurred in:
- Dallas: down 6.5%
- Fort Worth: down 6.2%
- Jacksonville: down 5.5%
A continued decline in new supply could place additional upward pressure on prices, especially if buyer demand remains firm.
| June 2026 Housing Market Highlights: United States | |||
|---|---|---|---|
| Market Metric | June 2026 | Month-over-Month Change | Year-over-Year Change |
| Median sale price | $408,776 | N/A | 2.2% |
| Existing-home sales, seasonally adjusted annual rate | 4,397,321 | 0.1% | 4.2% |
| Pending home sales | 349,254 | 0.5% | 4.5% |
| Homes sold | 302,606 | -0.4% | 4.5% |
| New listings | 376,762 | -0.8% | 0.1% |
| Total homes for sale (active listings) | 1,496,490 | 0.4% | 0.8% |
| Months of supply | 3.7 | -0.1 | -0.2 |
| Median days on market | 49 | Unchanged | 1 |
| Share of homes that sold below original list price | 59.5% | -0.6 ppts | -0.8 ppts |
| Average sale-to-original-list-price ratio | 96.4% | 0.1 ppts | 0.2 ppts |
| Pending sales that fell out of contract, as % of overall pending sales | 13.3% | -0.2 ppts | -0.3 ppts |
| Monthly average 30-year fixed mortgage rate | 6.49% | 0.05 ppts | -0.33 ppts |
Source: Redfin, June 2026 Housing Market Highlights. All figures are seasonally adjusted except median sale price and mortgage rate data. Percentage-point changes are shown as “ppts.”
.
Housing Conditions Vary Sharply by Metro
National averages do not represent every local market.
Home prices fell most significantly in:
- Seattle: down 4.9% year over year
- San Jose: down 3.9%
- Portland: down 1.8%
Pending sales posted their strongest annual gains in:
- San Francisco: up 16.4%
- Austin: up 13.2%
- West Palm Beach: up 13%
Closed sales rose most in West Palm Beach, San Francisco, and San Diego, while Philadelphia, Seattle, and Atlanta recorded the largest declines.
The variation shows why buyers cannot rely on national headlines alone. Local inventory, competition, pricing, property taxes, and mortgage costs determine the actual affordability of a home.
| June 2026 Full Metro-Level Data | ||||||||
|---|---|---|---|---|---|---|---|---|
| U.S. Metro Area | Median Sale Price |
Median Sale Price, Y/Y Change |
Pending Sales, Y/Y Change |
Homes Sold, Y/Y Change |
New Listings, Y/Y Change |
Active Listings, Y/Y Change |
Median Days on Market |
Median Days on Market, Y/Y Change |
| Anaheim, CA | $1,271,194 | 2.5% | 4.2% | 7.1% | -4.7% | 15.0% | 46 | 0 |
| Atlanta, GA | $408,776 | 0.7% | -0.7% | -3.7% | 1.5% | -1.1% | 61 | 2 |
| Austin, TX | $448,657 | 0.3% | 13.2% | 0.4% | -1.9% | 9.1% | 90 | 5 |
| Baltimore, MD | $438,686 | 4.5% | 1.6% | -2.6% | 12.3% | 3.2% | 38 | 4 |
| Boston, MA | $797,612 | -0.2% | 9.3% | 1.4% | 14.1% | 6.0% | 25 | 2 |
| Charlotte, NC | $428,716 | 0.9% | 3.4% | 0.9% | 7.6% | 4.9% | 66 | 5 |
| Chicago, IL | $408,776 | 6.2% | 5.2% | 0.8% | 0.5% | 4.7% | 54 | 0 |
| Cincinnati, OH | $324,030 | 2.7% | 6.5% | 3.0% | 15.0% | 3.5% | 44 | 2 |
| Cleveland, OH | $274,179 | 3.7% | 2.8% | 4.9% | 1.8% | 0.4% | 28 | -1 |
| Columbus, OH | $368,895 | -0.3% | 2.2% | 4.9% | 5.3% | -0.4% | 48 | 2 |
| Dallas, TX | $413,761 | -1.5% | -1.5% | 0.1% | -7.5% | -6.5% | 61 | 1 |
| Denver, CO | $607,070 | 0.4% | -3.1% | -0.1% | -5.8% | -0.7% | 39 | 3 |
| Fort Worth, TX | $368,796 | 2.3% | -0.2% | 5.6% | -8.6% | -6.2% | 57 | 0 |
| Houston, TX | $345,665 | 0.2% | -10.5% | -0.5% | -1.2% | 0.8% | 68 | 8 |
| Indianapolis, IN | $324,030 | -0.3% | 5.9% | 10.9% | 6.6% | 1.2% | 32 | 6 |
| Jacksonville, FL | $394,215 | 5.7% | 2.6% | -1.3% | -16.6% | -5.5% | 70 | -7 |
| Kansas City, MO | $363,910 | 1.1% | 1.7% | 2.9% | -4.4% | 1.2% | 22 | -1 |
| Las Vegas, NV | $453,642 | 0.8% | 7.4% | 10.3% | -0.2% | 0.6% | 68 | 8 |
| Los Angeles, CA | $947,164 | -0.2% | 5.6% | 2.9% | -4.1% | 3.9% | 49 | 1 |
| Miami, FL | $576,124 | 0.2% | 4.7% | 8.2% | -13.5% | -2.9% | 94 | 3 |
| Milwaukee, WI | $378,866 | 3.8% | 7.0% | 4.4% | 6.7% | 2.7% | 45 | 1 |
| Minneapolis, MN | $408,776 | 0.9% | 5.3% | 8.9% | 7.3% | 7.5% | 32 | 1 |
| Montgomery County, PA | $548,358 | 3.5% | 6.8% | 2.3% | 11.3% | 6.8% | 32 | 2 |
| Nashville, TN | $498,507 | 2.8% | 4.7% | 4.8% | 9.4% | 0.0% | 78 | 8 |
| Nassau County, NY | $781,161 | 4.9% | 5.7% | -1.7% | 2.5% | 1.2% | 34 | 1 |
| New Brunswick, NJ | $603,194 | 4.9% | 7.2% | 2.0% | 11.6% | 8.5% | 36 | -1 |
| New York, NY | $843,474 | 2.9% | 5.1% | -1.3% | 0.4% | -1.5% | 57 | 1 |
| Newark, NJ | $697,245 | 4.8% | 7.8% | 6.0% | 6.7% | 8.6% | 25 | -7 |
| Oakland, CA | $977,074 | 1.8% | -0.1% | 3.6% | -8.2% | 1.5% | 22 | -3 |
| Orlando, FL | $413,761 | 0.7% | 2.2% | 6.4% | -6.0% | 2.6% | 50 | -5 |
| Philadelphia, PA | $337,988 | 7.3% | 2.3% | -6.8% | 9.7% | 16.7% | 51 | 5 |
| Phoenix, AZ | $463,612 | 0.9% | 4.8% | 5.3% | -4.9% | -2.6% | 64 | 0 |
| Pittsburgh, PA | $291,527 | 9.1% | 1.4% | 2.8% | 11.5% | 9.8% | 62 | 3 |
| Portland, OR | $568,298 | -1.8% | 7.0% | 11.4% | -1.1% | 2.2% | 36 | 1 |
| Providence, RI | $547,361 | 4.3% | 5.9% | 9.9% | 4.4% | 4.9% | 30 | 1 |
| Riverside, CA | $588,234 | -1.1% | 2.2% | 1.6% | -12.4% | -1.4% | 53 | -2 |
| Sacramento, CA | $598,209 | -0.3% | 11.0% | 10.9% | -5.3% | -1.8% | 33 | -3 |
| San Antonio, TX | $328,985 | 2.8% | 1.7% | 2.1% | -0.8% | -1.7% | 81 | -1 |
| San Diego, CA | $952,149 | 3.9% | 2.4% | 12.8% | -5.9% | 5.3% | 34 | -3 |
| San Francisco, CA | $1,724,835 | 9.2% | 16.4% | 23.1% | -15.7% | 2.2% | 20 | -3 |
| San Jose, CA | $1,615,164 | -3.9% | 6.3% | -0.4% | 6.9% | -3.6% | 21 | 2 |
| Seattle, WA | $827,522 | -4.9% | -10.8% | -5.9% | 12.3% | 0.2% | 25 | 9 |
| St. Louis, MO | $309,075 | 5.7% | 3.8% | 7.0% | 13.3% | 13.0% | 31 | -2 |
| Tampa, FL | $391,328 | 3.0% | -1.8% | 2.2% | -10.4% | -1.6% | 46 | -1 |
| Virginia Beach, VA | $398,806 | 5.2% | -1.9% | 5.1% | -0.3% | 2.7% | 35 | 0 |
| Washington, DC | $623,134 | 2.7% | 1.0% | 3.6% | 8.1% | 5.5% | — | — |
| West Palm Beach, FL | $548,358 | 8.6% | 13.0% | 23.8% | -6.4% | 2.4% | 81 | -8 |
Source: Redfin, June 2026 Full Metro-Level Data. The table covers major U.S. metropolitan areas included in Redfin’s June 2026 housing-market analysis. All percentage changes shown are year-over-year changes. Washington, DC median-days-on-market figures were not provided in the source table.
.